Oxide provides metrics natively via OxQL and tracks user actions in the audit log. For integration with external observability tools, you can use the Oxide OpenTelemetry receivers, which collect metrics and audit logs from the Oxide API and export them to any OpenTelemetry-compatible destination, such as Prometheus, Loki, or Datadog.
Use the binary
The Oxide OpenTelemetry receiver runs as part of an OpenTelemetry Collector binary. First, download the binary for your OS and architecture for the latest version of the receiver:
$ OS=linux ARCH=amd64
$ curl -L -o otelcol-oxide https://github.com/oxidecomputer/opentelemetry-collector-components/releases/latest/download/otelcol-oxide-$OS-$ARCH
$ chmod +x otelcol-oxideopentelemetry-collector-components repository provides an OpenTelemetry Collector distribution with a standard set of OpenTelemetry receivers, processors, and exporters. To change the set of OpenTelemetry components, follow the instructions in the opentelemetry-collector-components repository.Configure the OpenTelemetry collector
We provide an example configuration file that reads metrics from an Oxide rack and exports them using the Prometheus exposition format on port 9091, and collects audit logs and pushes them to a Loki instance (if available) via OTLP. To run the Collector, copy the example configuration to a new file, update it as necessary, and start the binary. The OpenTelemetry receivers support the standard Oxide environment variables; you must set either OXIDE_PROFILE, or both OXIDE_HOST and OXIDE_TOKEN, to authenticate to the Oxide rack.
$ curl -o config.yaml https://raw.githubusercontent.com/oxidecomputer/opentelemetry-collector-components/refs/heads/main/collector/config.example.yaml
$ ./otelcol-oxide --config config.yaml
Now you can fetch current metrics using the Prometheus exposition format at localhost:9091. It may take a few seconds for all the metrics to be collected the first time. Audit logs are pushed to the configured OTLP endpoint (in this example, Loki); to verify audit log collection, use the container example below.
$ curl http://0.0.0.0:9091/metrics

# HELP bgp_session:active_connections_accepted_total
# TYPE bgp_session:active_connections_accepted_total counter
bgp_session:active_connections_accepted_total{hostname="oxz_switch",local_asn="65002",otel_scope_name="",otel_scope_schema_url="",otel_scope_version="",peer="172.20.15.43",rack_id="de608e01-b8e4-4d93-b972-a7dbed36dd22",sled_id="71def415-55ad-46b4-ba88-3ca55d7fb287"} 2
bgp_session:active_connections_accepted_total{hostname="oxz_switch",local_asn="65002",otel_scope_name="",otel_scope_schema_url="",otel_scope_version="",peer="172.20.15.51",rack_id="de608e01-b8e4-4d93-b972-a7dbed36dd22",sled_id="87c2c4fc-b0c7-4fef-a305-78f0ed265bbc"} 2
See the receiver repo for configuration options and examples.
Use the container
For a more complete example, the Docker Compose quickstart runs the OpenTelemetry Collector along with Prometheus for metrics, Loki for audit logs, and Grafana for dashboards.
OXIDE_HOST and OXIDE_TOKEN environment variables, or add authentication details to your OpenTelemetry configuration file.git clone https://github.com/oxidecomputer/opentelemetry-collector-components.git
cd opentelemetry-collector-components
cp collector/config.example.yaml collector/config.yaml
docker compose -f example/docker-compose.yaml up --buildOnce the example is running, you can access the following services:
Prometheus: http://localhost:9090
Grafana: http://localhost:3000
Loki: http://localhost:3100
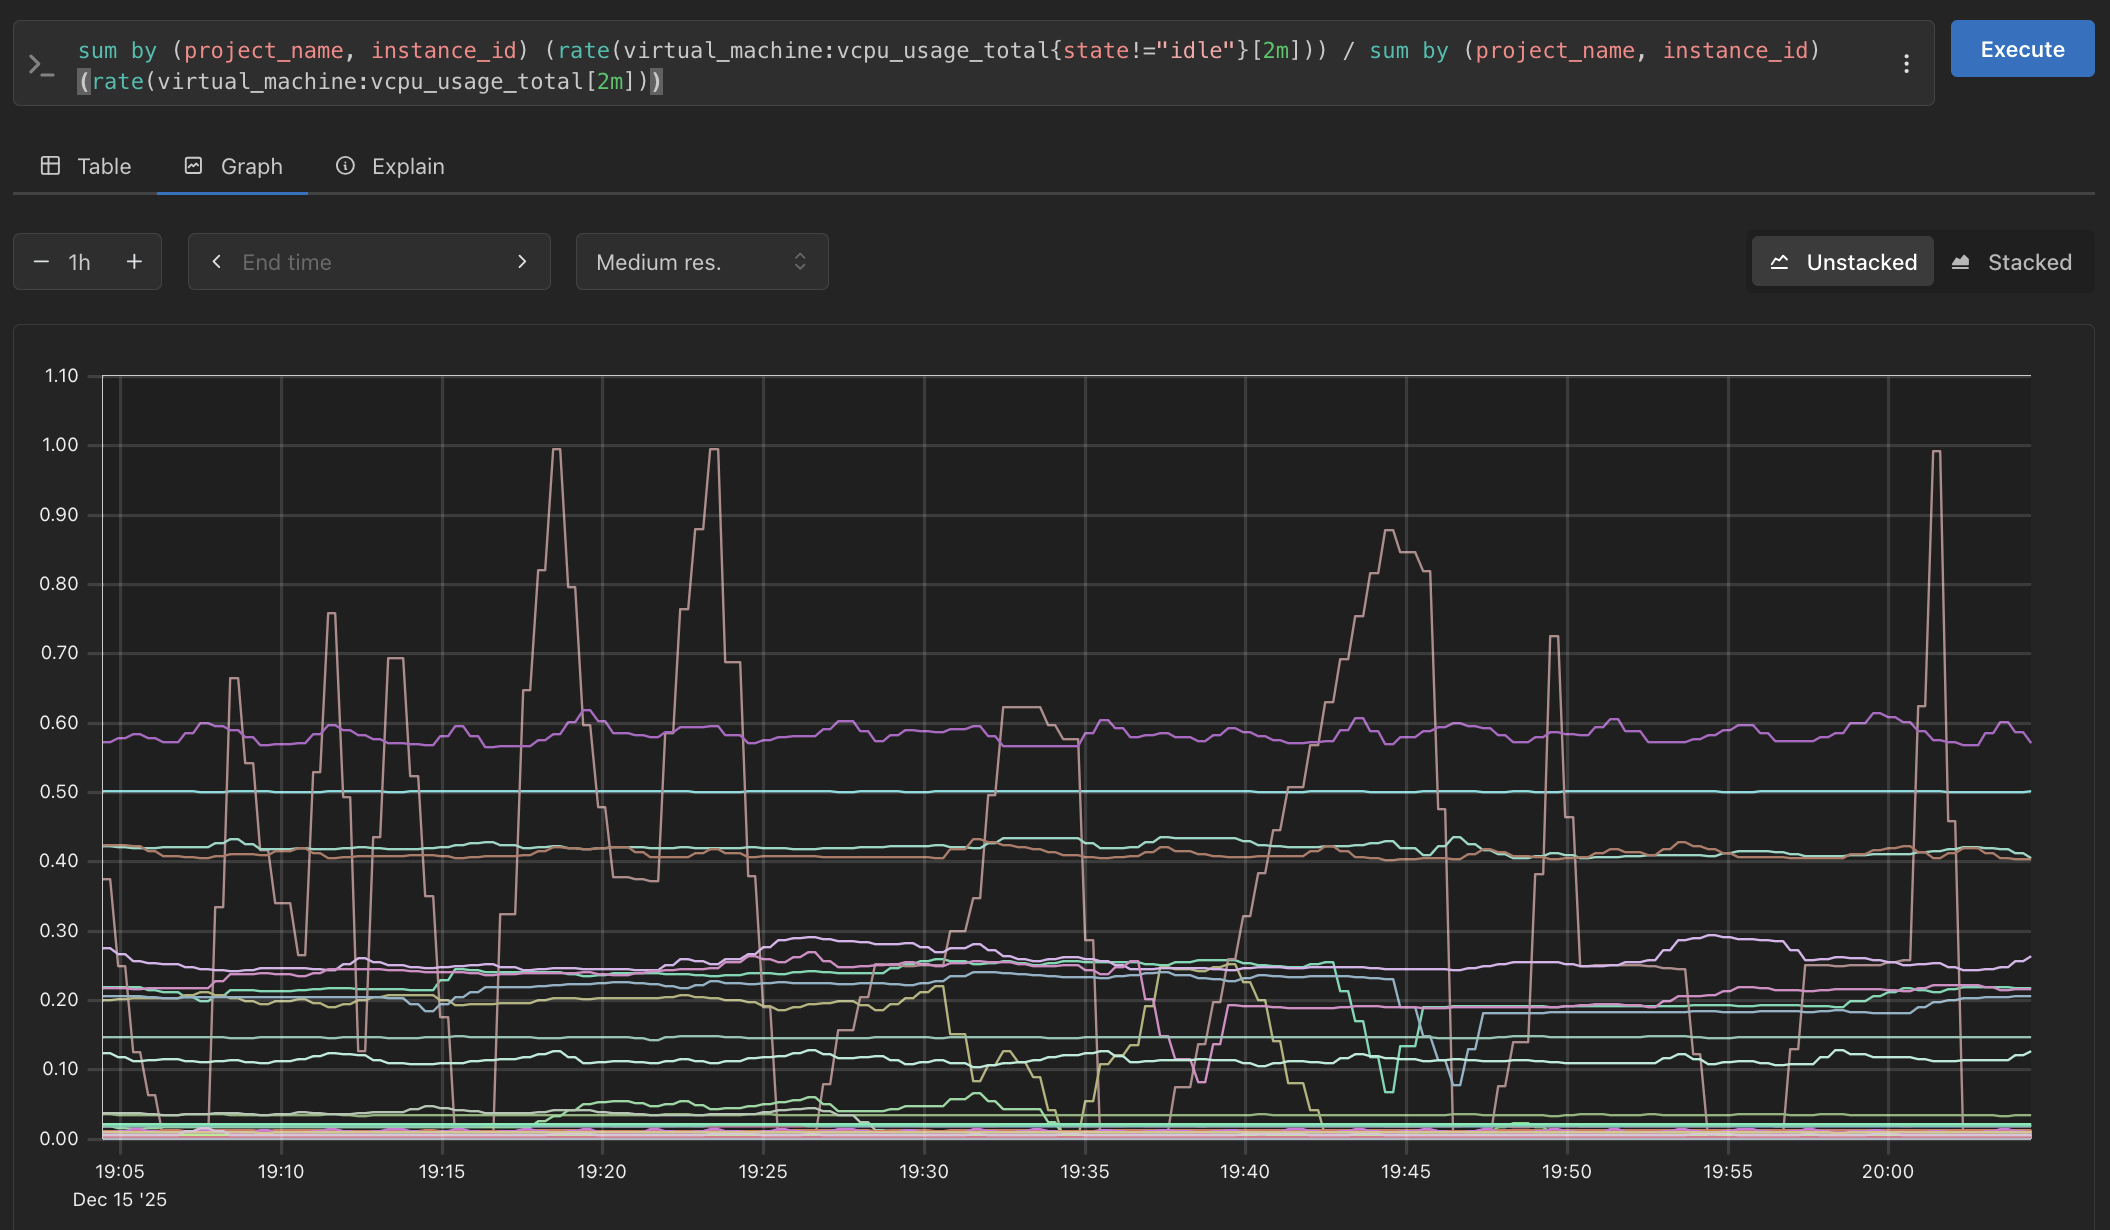
For example, you can plot the average current by slot in Prometheus using sum by (slot) (hardware_component:current):
Audit logs are available in Grafana via the Loki data source. You can also query Loki directly using its HTTP API:
$ curl -s -G http://localhost:3100/loki/api/v1/query_range \
    --data-urlencode 'query={service_name="oxide"}' \
    | jq .